This page includes figures and a brief summary my work (except where indicated) from the published journal article on this project. The published article can be found here.
The purpose of this project is to verify the efficacy of a rapidly constructed isolation space in a nursing home ward. The construction of the isolation space consisted of alterations to the HVAC system so that it was fully exhaust, and the construction of an anteroom between the ward and the rest of the nursing home. The anteroom was controlled as the only entry/exit point of the space.

The CAD model of the ward shown left was created using mechanical drawings and measurements from the on-site maintenance staff. his model is a 1:1 reduced order representation and all vent locations and sizes and modeled accurately.
The doors were not modeled (assumed open) for a worst case infection transmission analysis (results shown at end). Windows were approximated as a narrow rectangular opening, the length of which matches the width of the real windows. Domain extensions were added at the inlets and outlets to allow the flow to develop in the simulation before entering the domain proper.

The boundary conditions of the vents were determined based on the real specifications of the HVAC system. The figure at right shows the flow rate of the two HVAC systems and which vents were connected to each system. Also shown is the flow rate of the HEPA filter placed in the anteroom that controlled entry/exit into the ward.
An important metric for HVAC system design is Air Changes per Hour (ACH). ACH indicates the amount of time that the volume of air in the room is cycled through per hour by the HVAC system. Higher ACH values lead to lower infection transmission risk because, intuitively, the setup will be more likely to remove respiratory droplets from the space. The ACH of the entire ward is 12.20.

Notes:
1) The GIF on the left may take some time to load.
2) You will see the mesh in the velocity results. The fineness of the mesh was limited by the license available to me.
The figure at left shows the velocity results of the compressible CFD simulation performed in SimScale. This animation moves from the floor to the ceiling of the domain. Plainly evident is an influx of air through the windows, anteroom, and HVAC filter in the anteroom. As the animation passes the vents above the room doors, we can also see a relatively small region of high velocity, indicating that air is flowing out of the domain at these locations. We further illustrated this with arrows indicating speed and direction of air but these are not included in the animation for ease of viewing.
The purpose of this verification is a quick verification that our results make intuitive sense and that the HVAC system functions as designed. The HVAC system only removes air, and the only controlled influx of air is through the HEPA filter so, as expected, air comes into the domain from the windows. While this makes intuitive sense, this does not guarantee that our results are representative of the real isolation space.

For full verification, we would require that our simulation pressure results agree with on-site pressure measurements. Two on-site, relative pressure measurements were taken, 1) between the isolation space and the anteroom and 2) between the anteroom and a nursing station outside of the anteroom. The simulation results were given in absolute pressure values, so absolute pressure was found using NOAA data. The nursing station outside of the anteroom was assumed to be at this absolute pressure value.

The absolute pressure value was used to find the relative pressure of our simulation results with respect to the anteroom pressure. We then compared the pressure measurements to the simulation pressure results at the same location. These pressure values agree, verifying that our simulation results accurately represent the actual domain.
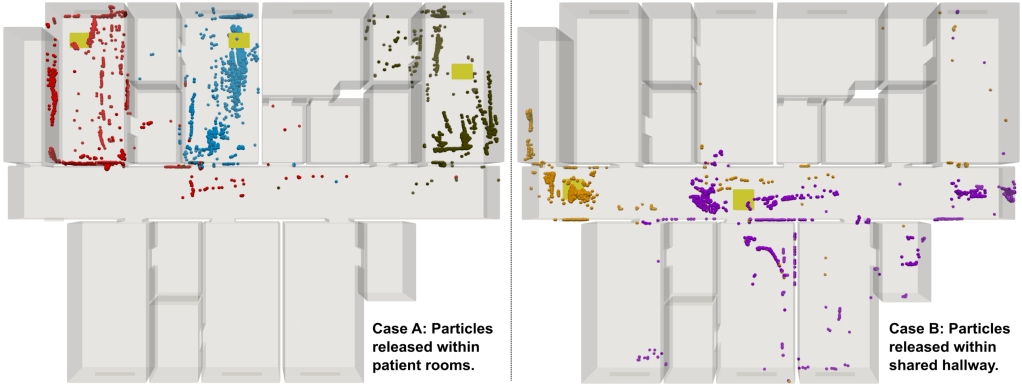
With simulation data that is verified to be accurate of the isolation space, we can perform a particle simulation to determine possible transmission risks. As noted earlier, the doors of the ward were not included in the model so that a worst case scenario could be analyzed.
The simulation results at right were performed by one of my co-authors and show that particles released from one room can travel to another, and that particles released from the hallway can travel into a room. With this, we were able to advise that the doors in the ward should be closed at all times (already in practice) and that healthcare workers should not remove their protective gear at any location in the ward.
Note that the particles were modeled as tracers. They follow the exact path of the air from their starting location. This project uses more advanced particle simulation methods.
