This page includes figures and a brief summary my work from the published journal article on this project. The published article can be found here.
The purpose of this project is to quantify the effects that HVAC vent placement have on infection transmission risk. To accomplish this, a parametric room design was created where the only changes between room configurations is the location of the vents. A novel method of quantifying exposure risk was developed to illustrate the risk of exposure from one occupant to another.

Six different room configurations were created, all of them based on a 4 m x 4 m x 3 m room. The names of each configuration are a three unit code. The first unit is either 90 or 180, indicating that the vents are placed on orthogonal or opposite walls respectively. The second code is either U or L and indicates if the inlet vent is up higher on the wall or lower on the wall. The third code follows the same convention as the second code and indicates the position of the exhaust vent.
The window and door were approximated as narrow rectangular openings. Domain extensions were added at the inlets and outlets to allow the flow to develop in the simulation before entering the domain proper. Dimensions of these were based on results found from this previous project.
There were no human models included in the CAD models to increase the parametric capabilities of the study. This allowed us to mathematically represent multiple humans in the domain without running a new simulation. However, this does mean that heat from a human body is not included in the simulation which is an important factor in these simulations. The decision to leave humans out was made because the focus of this study was on the development of the methodology, rather than a study based on a more realistic occupation scenario.
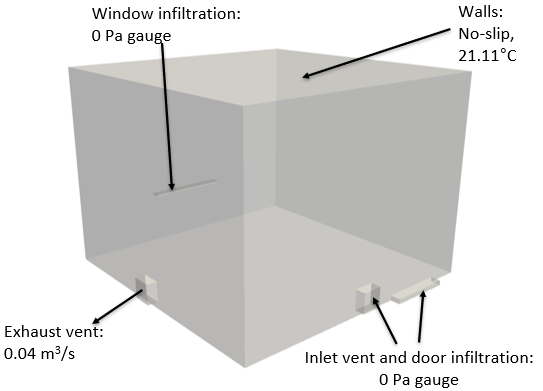
The boundary conditions were chosen as indicated on the right. The exhaust vent boundary condition represents and exhaust driven HVAC system. An incompressible, Boussinesq simulation was performed in SimScale for each of the six configurations, each with the same boundary conditions.
The parametric changes allowed for the comparison of infection transmission risk based on changes to HVAC pattern.

The velocity results of all simulations are shown at left. They are grouped into the 180 simulations and 90 simulations for ease of comparison. The velocity results show significant differences between each case, allowing for the possibility of infection transmission risk comparison between cases. Streamlines were calculated for each case and indicate the presence of recirculation zones which, intuitively, are likely to increase infection transmission risk to the occupants.

The figure at right illustrates how the novel approach of infection transmission risk was developed. As particles released from the patient are transported throughout the domain, they can be close enough to a subject that there is a risk of the subject inhaling the particle.
To represent this risk, four spherical exposure zones were mathematically represented, each with a different weighted value between 0 and 100. The weight of the zone represents its relative risk of inhalation by the subject based on proximity to the surface of the head. Zone 1 had a weight of 100 and the remaining weights were linearly distributed to 0 for particles outside of the domain.
Also accounted for in this calculation is the viability the viral as determined in this study by van Doremalen et al. The full equation for this calculation of exposure risk can be found in the article linked at the top of this page.
The gif on the left may take some time to load.
This animation shows how particles released from the shown individual might propagate in a room during one hour. The simulation techniques for these particles were written in Python. This result is from an individual releasing particles into the 180-U-L room configuration. As evident from the animation, respiratory droplets can be transported throughout the entire room, potentially infecting individuals throughout the space.
To quantify this risk of exposure, we can mathematically place individuals throughout the room and use the quantification method described in the last image.
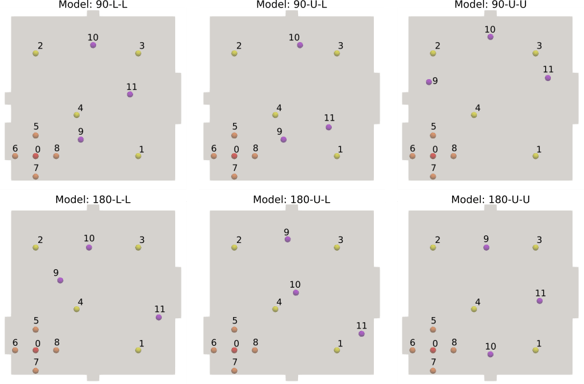
A total of 11 exposed subjects were used for an exposure analysis from one infected individual. The figure shown at right indicated the location of subjects for each room configuration when Subject 0 is the infected individual (shown in red). The subjects shown in yellow were iteratively chosen as the infected individual and these simulations were performed separately. The subjects shown in orange are placed near the infected subject and their relative position to the infected subject is always the same, e.g. Subject 5 is always 0.5 m away from the infected subject in the +x direction.
The 11 exposure calculations per each of the 120 Room Configuration/Infected Subject/Particle Model set gives us a total of 1,320 data points. The exposure risk for each of the 11 individuals can be calculated at the same time using one of the 120 sets described earlier.
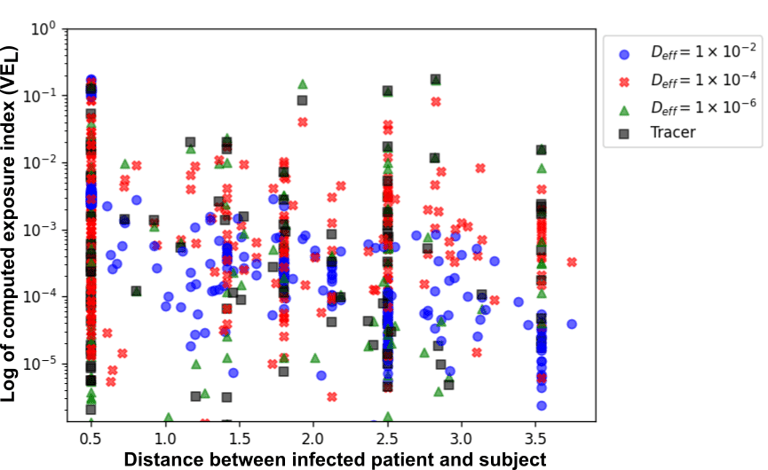
Shown here are the 1,320 calculated exposure indices on a log-y scale as a function of the distance between the infected subject (patient) and the exposed subject in meters. From these results, it appears that the six feet social distancing guidelines are not enough to guarantee zero exposure risk in indoor spaces. This means that masks should still be worn indoors as their effectiveness at reducing infection transmission risk is well documented.
